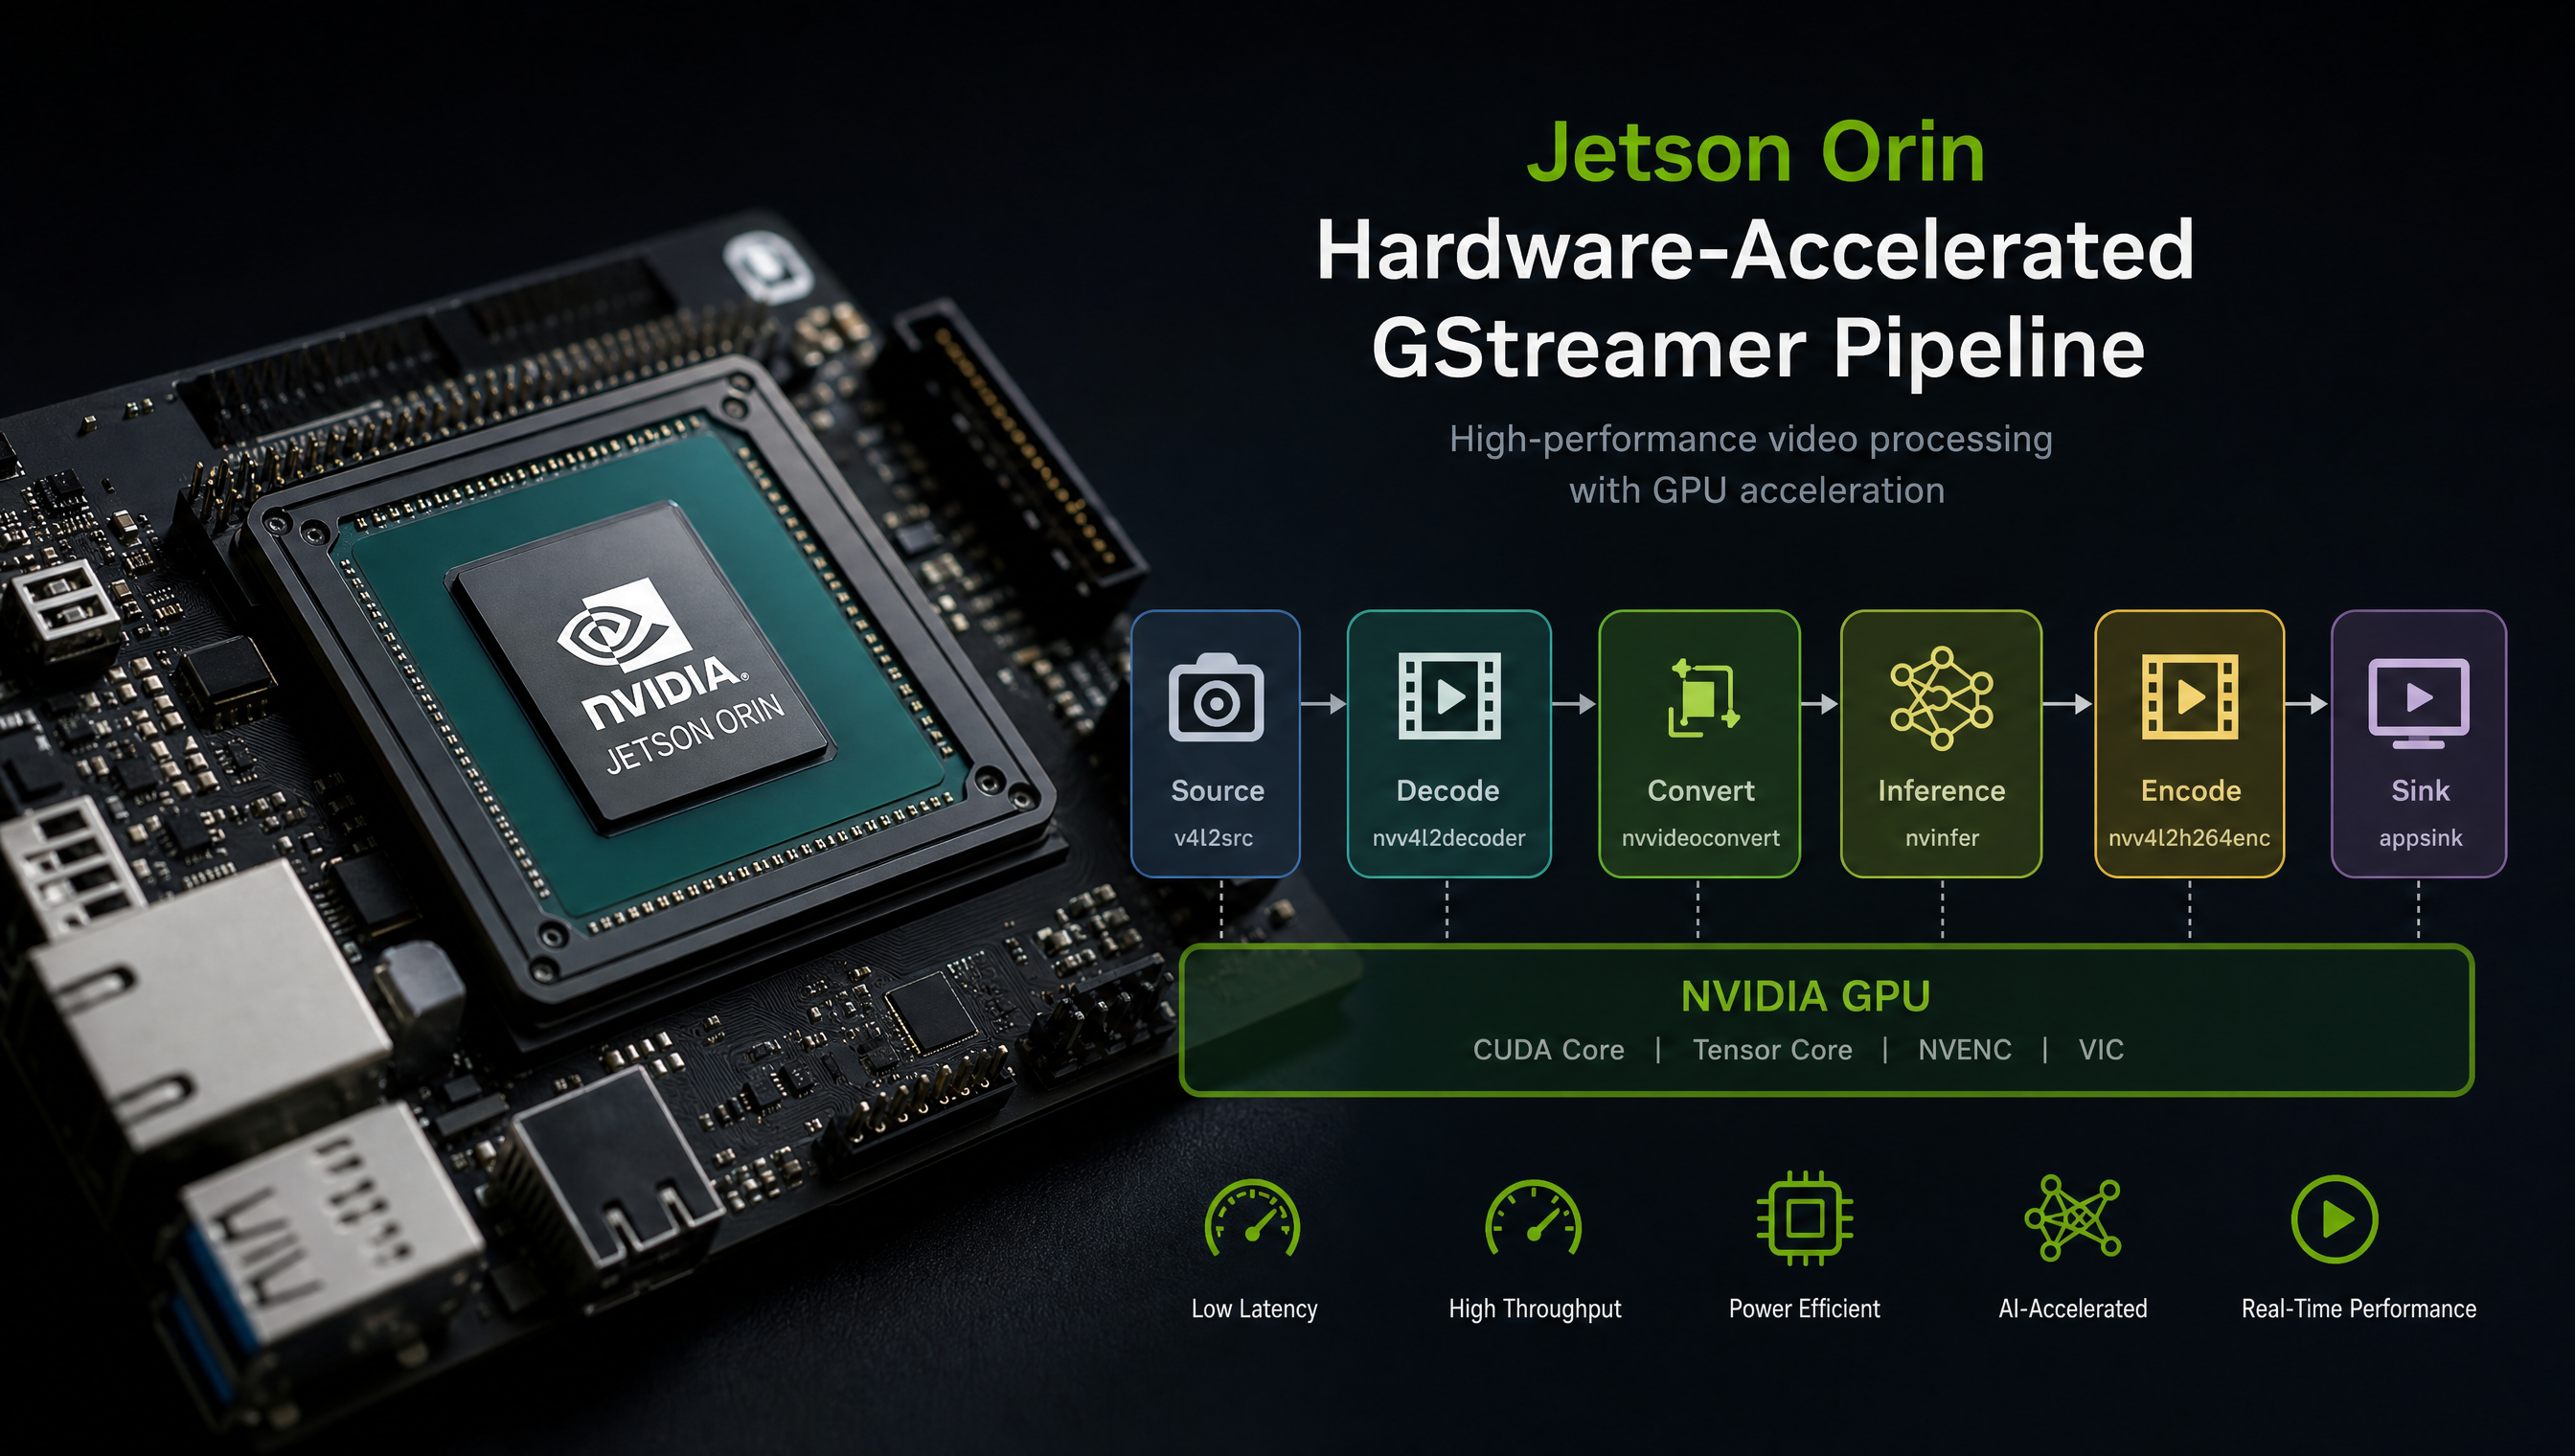
GStreamer pipeline performance on Jetson: fix slow pipelines
GStreamer pipeline performance on Jetson depends heavily on how well the pipeline uses NVIDIA hardware-accelerated elements. A pipeline with the wrong element choices can run at the same throughput on Jetson as on a generic ARM board, losing all the GPU acceleration. This post covers how to build pipelines that actually use the hardware.
How to reduce end-to-end latency in a Jetson GStreamer pipeline
The dominant source of latency in a Jetson GStreamer pipeline is almost always a memory copy between system RAM and NVMM, not compute. Every time a CPU-based element like videoconvert or appsink receives an NVMM buffer, GStreamer copies the frame to system memory before passing it. On a 1080p30 stream that copy costs ~5-15ms per frame and saturates memory bandwidth.
The five most effective latency reductions, in order of impact:
- Replace
videoconvertwithnvvidconveverywhere, VIC hardware handles format conversion in NVMM without CPU involvement - Add
sync=falseon all sinks (e.g.,nv3dsink sync=false,appsink sync=false), disabling clock synchronization eliminates the presentation timestamp delay - Use
queue leaky=2 max-size-buffers=1before slow elements, drop old frames instead of buffering them, keeping end-to-end delay at one frame - Replace
avdec_h264withnvv4l2decoderfor decode, hardware decode adds ~2ms vs ~20ms for software decode at 1080p - Process frames in a GLib idle callback or separate thread from
appsink, a slow Python callback inon_new_sampleblocks the entire pipeline
A camera-to-display pipeline with all five applied typically achieves under 50ms end-to-end latency on Jetson Orin at 1080p30.
How to build a hardware-accelerated GStreamer live streaming pipeline on Jetson
A hardware-accelerated live streaming pipeline on Jetson keeps all processing in NVMM, from camera capture through encode, and transmits over UDP or RTSP with no CPU involvement in the video path.
Camera to UDP (single stream, lowest latency):
# Sender, Jetson
gst-launch-1.0 \
  nvarguscamerasrc sensor-id=0 ! \
  'video/x-raw(memory:NVMM),width=1920,height=1080,framerate=30/1' ! \
  nvv4l2h264enc bitrate=4000000 iframeinterval=30 ! \
  h264parse ! rtph264pay ! \
  udpsink host=192.168.1.100 port=5000 sync=false

# Receiver, laptop or remote host
gst-launch-1.0 \
  udpsrc port=5000 ! \
  'application/x-rtp,encoding-name=H264,payload=96' ! \
  rtph264depay ! avdec_h264 ! autovideosink
Camera to file while streaming simultaneously (tee):
gst-launch-1.0 \
  nvarguscamerasrc sensor-id=0 ! \
  'video/x-raw(memory:NVMM),width=1920,height=1080,framerate=30/1' ! \
  nvv4l2h264enc bitrate=4000000 ! h264parse ! \
  tee name=t \
    t. ! queue ! rtph264pay ! udpsink host=192.168.1.100 port=5000 sync=false \
    t. ! queue ! qtmux ! filesink location=/tmp/recording.mp4
Key settings for low-latency streaming:
iframeinterval=30, keyframe every 30 frames (1 second at 30fps); lower = faster seek/recovery, higher bitratesync=falseon udpsink, disables presentation clock; without this, the sink adds presentation delaynvv4l2h264encvsx264enc, hardware encoder uses <1% CPU; x264enc uses 40-60% CPU at 1080p30- Add
queue max-size-buffers=1 leaky=2before udpsink to drop old frames if the network is slow rather than building a backlog
For multi-client streaming, the gst-rtsp-server library wraps the pipeline in an RTSP server. A Python example using GstRtspServer is the cleanest approach for production deployments.
Key Insights
- The main bottleneck on Jetson GStreamer pipelines is almost always memory copies between system RAM and NVMM, not compute, keep data in NVMM from camera to output
- Replace
videoconvertwithnvvidconveverywhere in a Jetson pipeline; the VIC hardware handles format conversion without touching the CPU - Use
nvv4l2decoderinstead ofavdec_h264for decode, hardware decode on Jetson handles 4K at a fraction of the CPU cost of software decode appsinkwith a slow Python callback is the most common hidden bottleneck, the pipeline backs up waiting for your callback to returnGST_DEBUG_DUMP_DOT_DIRlets you visualize the full pipeline graph and spot where formats are negotiated incorrectly
Hardware-accelerated vs CPU element reference
Use this table when building or auditing a Jetson GStreamer pipeline. Every CPU element in the left column is a potential performance sink, the right column is its hardware replacement.
| CPU element | Hardware replacement | Hardware engine | Notes |
|---|---|---|---|
videoconvert | nvvidconv | VIC | Drop-in replacement for format/colorspace conversion |
avdec_h264 | nvv4l2decoder | NVDEC | Add h264parse upstream |
avdec_h265 | nvv4l2decoder | NVDEC | Set disable-dpb=1 for low-latency |
x264enc | nvv4l2h264enc | NVENC | Set bitrate and iframeinterval |
x265enc | nvv4l2h265enc | NVENC | |
jpegdec | nvjpegdec | VIC | Required for camera MJPEG streams |
jpegenc | nvjpegenc | VIC | |
videoscale | nvvidconv | VIC | nvvidconv handles both scaling and format conversion |
videocrop | nvvidconv with left/right/top/bottom | VIC | |
autovideosink | nvdrmvideosink or nv3dsink | Display engine | autovideosink often picks a CPU path |
If you see any left-column element in your pipeline, replace it. One videoconvert in the middle of an otherwise NVMM pipeline forces every frame through system RAM.
GStreamer element performance comparison on Jetson Orin
These numbers are from single-stream 1080p30 pipelines on Jetson AGX Orin. Multi-stream pipelines see proportional savings.
| Pipeline element | CPU usage | GPU/VIC engine | Notes |
|---|---|---|---|
videoconvert (color convert) | 25–35% | none | Software; scales with resolution |
nvvidconv (color convert) | <1% | VIC | Hardware; resolution-independent CPU cost |
avdec_h264 (decode) | 35–50% | none | Software; one core saturated at 1080p30 |
nvv4l2decoder (decode) | 1–2% | NVDEC | Hardware; handles 4K30 at same CPU cost |
x264enc (encode) | 50–70% | none | Software; 1080p30 uses 1+ cores |
nvv4l2h264enc (encode) | <2% | NVENC | Hardware; handles 4K30 at same CPU cost |
autovideosink | 5–15% | varies | Often picks a CPU path; replace with nvdrmvideosink |
nvdrmvideosink | <1% | display engine | Direct DRM framebuffer; no compositor overhead |
Pipeline audit formula: If your pipeline’s total CPU usage is above 5% at 1080p30 on Orin, you have at least one CPU element in the path. Run htop and look at per-core utilization, a saturated single core points to software decode or encode. CPU spread across cores at moderate load points to videoconvert or appsink with a slow callback.
The unified memory architecture, and why it matters for pipelines
Jetson uses unified memory, the CPU and GPU share the same physical DRAM. This is different from a discrete GPU setup where CPU memory and GPU VRAM are separate. On Jetson, zero-copy between CPU and GPU is theoretically possible, but only when both sides use the right memory type.
NVIDIA’s GStreamer plugins use NVMM buffers: a memory-mapped buffer that the GPU hardware engines (VIC, NVDEC, NVENC, DLA) can access without a DMA copy. The problem comes when you insert a CPU-based element into a pipeline that was otherwise entirely NVMM.
nvarguscamerasrc → nvvidconv → nvinfer → nvvidconv → nveglglessink
      NVMM          NVMM        NVMM       NVMM          NVMM
This is a zero-copy pipeline. Everything stays in NVMM.
nvarguscamerasrc → videoconvert → appsink
      NVMM           ← COPY →    system RAM
This copies every frame from NVMM to system RAM at videoconvert. On a 4K 30fps stream, that’s roughly 720MB/s of unnecessary memory bandwidth.
Identify the element causing the bottleneck
The fastest diagnostic is the GST pipeline graph. Set this before running your pipeline:
export GST_DEBUG_DUMP_DOT_DIR=/tmp
Then run your pipeline. After it starts (or crashes), .dot files appear in /tmp. Convert to PNG:
sudo apt install graphviz
dot -Tpng /tmp/pipeline*.dot -o /tmp/pipeline.png
Open the PNG. Look for:
- Elements showing
video/x-raw(nomemory:NVMM), these are CPU-path elements causing copies - Caps negotiation failures, elements trying to send NVMM to a CPU-only sink
For runtime profiling, use GST_DEBUG with specific elements:
GST_DEBUG=nvvidconv:4,nvinfer:4,appsink:4 gst-launch-1.0 \
  nvarguscamerasrc ! nvvidconv ! nvinfer config-file-path=det.cfg ! \
  nvvidconv ! nvdrmvideosink
The logs will show per-element timing and buffer flow.
The 4 patterns that kill throughput
Pattern 1: videoconvert in a hardware pipeline
The symptom is high CPU usage (70%+) on a pipeline that should be GPU-accelerated. The cause is one videoconvert element in the middle, forcing everything before and after it through system RAM.
Replace every videoconvert with nvvidconv:
# Slow (CPU path)
... ! videoconvert ! video/x-raw,format=BGR ! appsink

# Fast (hardware path)
... ! nvvidconv ! video/x-raw(memory:NVMM),format=NV12 ! nvvidconv ! \
    video/x-raw,format=BGRx ! appsink
The second nvvidconv handles the final conversion out of NVMM before the CPU-side sink.
Pattern 2: Software decode
avdec_h264 is a CPU-based H.264 decoder. On Jetson, use nvv4l2decoder instead:
# Slow
... ! h264parse ! avdec_h264 ! videoconvert ! autovideosink

# Fast
... ! h264parse ! nvv4l2decoder ! nvvidconv ! nvdrmvideosink
nvv4l2decoder uses the NVDEC hardware engine. On Jetson Orin, this handles 4K H.264 at roughly 1% CPU vs 40%+ for the software decoder.
Pattern 3: Slow appsink callback
appsink is how you pull frames into Python or C++ code. If your callback takes longer to process a frame than the pipeline produces them, the queue fills up and GStreamer stalls.
The default queue behavior is to block. Your pipeline backs up, your camera drops frames, and latency climbs. Fix it by setting a maximum buffer count and drop policy:
appsink = pipeline.get_by_name("appsink0")
appsink.set_property("max-buffers", 1)
appsink.set_property("drop", True)
appsink.set_property("emit-signals", True)
drop=True means the sink drops old frames rather than blocking the pipeline. You lose frames but maintain real-time processing. If you can’t afford to drop frames, you need to speed up the callback, move heavy work off the GStreamer thread with a separate processing queue.
Pattern 4: Missing queue elements
GStreamer runs elements in the same thread by default unless you insert queue elements to split into separate threads. A pipeline with a slow sink element (like a network sink) will block the camera source thread without a queue between them:
nvarguscamerasrc ! nvvidconv ! queue max-size-buffers=4 ! \
    nvv4l2h264enc ! rtph264pay ! udpsink host=192.168.1.100 port=5000
The queue element decouples the camera thread from the encoder/network thread. Without it, network jitter stalls the camera.
How to run multiple camera streams with nvstreammux
nvstreammux is the right way to handle multi-camera pipelines on Jetson, it batches multiple NVMM streams into a single batch buffer that nvinfer processes in one GPU inference call. Running a separate nvinfer per camera is ~4x less efficient for inference.
Basic 4-camera setup:
gst-launch-1.0 \
  nvstreammux name=mux batch-size=4 width=1920 height=1080 \
    batched-push-timeout=4000000 ! \
  nvinfer config-file-path=config_infer.txt ! \
  nvmultistreamtiler rows=2 columns=2 width=1920 height=1080 ! \
  nvvidconv ! nv3dsink \
  nvarguscamerasrc sensor-id=0 ! \
    'video/x-raw(memory:NVMM),width=1920,height=1080,framerate=30/1' ! \
    nvvidconv ! mux.sink_0 \
  nvarguscamerasrc sensor-id=1 ! \
    'video/x-raw(memory:NVMM),width=1920,height=1080,framerate=30/1' ! \
    nvvidconv ! mux.sink_1 \
  nvarguscamerasrc sensor-id=2 ! \
    'video/x-raw(memory:NVMM),width=1920,height=1080,framerate=30/1' ! \
    nvvidconv ! mux.sink_2 \
  nvarguscamerasrc sensor-id=3 ! \
    'video/x-raw(memory:NVMM),width=1920,height=1080,framerate=30/1' ! \
    nvvidconv ! mux.sink_3
Key properties to set on nvstreammux:
batch-size, must match the number of input streamsbatched-push-timeout, microseconds to wait for a full batch before pushing a partial one; 4000000 (4ms) is a good starting point for 30fpslive-source=1, set this when reading from live cameras, not files; it prevents the muxer from blocking on slow streams
For GMSL2 multi-camera pipelines, the input comes from nvarguscamerasrc with virtual channel demuxing upstream. The muxer sink pad assignment must match the virtual channel order from the deserializer. If you’re seeing frames from the wrong camera on the wrong output, check the VC-to-sink mapping in your deserializer device tree.
A profiling pipeline for benchmarking
This pipeline measures pure throughput from camera to nowhere, useful for finding your theoretical maximum before you add processing:
gst-launch-1.0 -v \
  nvarguscamerasrc num-buffers=300 ! \
  'video/x-raw(memory:NVMM),width=1920,height=1080,framerate=30/1' ! \
  nvvidconv ! \
  'video/x-raw(memory:NVMM),format=NV12' ! \
  fakesink sync=false
fakesink drops all frames immediately with no rendering overhead. If this pipeline runs at full framerate, your hardware can handle the resolution. If it drops frames here, the bottleneck is upstream of processing, check camera driver configuration and MIPI bandwidth.
For network streaming pipelines, see the GStreamer development service page. If you’re comparing building this yourself against using an external specialist like RidgeRun, the RidgeRun vs ProventusNova comparison has a direct breakdown.
Common GStreamer errors on Jetson and what they mean
no element "nvvidconv"
The NVIDIA GStreamer plugins aren’t installed or aren’t on the plugin path. Fix:
sudo apt install --reinstall gstreamer1.0-plugins-nvargus gstreamer1.0-nvvideo4linux2
gst-inspect-1.0 nvvidconv  # should print the element description
Inside Docker, the container must use --runtime=nvidia and have the NVIDIA GStreamer libraries available. The simplest fix is to base your container on nvcr.io/nvidia/l4t-base which includes them.
video/x-raw(memory:NVMM) not compatible with video/x-raw
A CPU-side element is receiving an NVMM buffer it can’t handle. This usually happens when appsink or videoconvert is immediately downstream of an NVMM-producing element. Insert an nvvidconv before the CPU element to convert out of NVMM:
... ! nvvidconv ! video/x-raw,format=BGRx ! appsink
internal data flow error / pipeline stops after a few seconds
Usually a queue overflow. Your appsink callback or downstream element is slower than the source. Set max-buffers=1 drop=true on appsink, or add queue leaky=2 max-size-buffers=2 before the slow element.
nvarguscamerasrc no cameras available
The camera isn’t initialized or the NVCSI driver can’t find it. Check dmesg | grep nvcsi for errors. This is almost always a driver or device tree issue, not a GStreamer issue, the pipeline is fine, the camera isn’t presenting itself to the driver. For bring-up problems at this layer, see what’s involved in CSI camera driver development.
failed to allocate required memory
Jetson’s unified memory is exhausted. Reduce the number of streams, lower resolution, or reduce nvstreammux batch size. On Jetson Orin NX (16GB), this typically only happens above 8 simultaneous 1080p streams without careful memory management.
If you’re hitting performance ceilings that go beyond pipeline configuration, custom hardware, unusual sensor combinations, or production latency requirements, the GStreamer development service page outlines how a fixed-bid engagement works.
Relevant Services
NVIDIA Jetson Expert Support
Stuck on a Jetson bring-up?
We've debugged this failure mode before. BSP, device tree, camera pipelines, OTA, most blockers clear in the first session. No long retainers. No guessing.
Frequently Asked Questions
Why is my GStreamer pipeline slow on Jetson even though it runs fine on a desktop?
Desktop CPUs have more cores and higher memory bandwidth. On Jetson, the CPU and GPU share memory (unified memory architecture), but GStreamer pipelines that mix CPU-based elements with GPU-accelerated elements cause data copies between system memory and NVMM. Each memory copy is expensive. The fix is to use hardware-accelerated elements (nvvidconv, nvv4l2decoder, nvinfer) throughout the pipeline and keep data in NVMM memory as long as possible.
What is NVMM memory in GStreamer on Jetson?
NVMM (NVIDIA Memory Manager) is a zero-copy memory buffer that lives in the GPU's address space on Jetson. Elements like nvvidconv, nvinfer, and nvarguscamerasrc produce and consume NVMM buffers without copying to system RAM. When a CPU-based element like videoconvert receives an NVMM buffer, it has to copy it to system memory first, that copy is usually where latency comes from on Jetson pipelines.
What is the difference between nvvidconv and videoconvert in GStreamer?
videoconvert is a CPU-based color space conversion element. nvvidconv is NVIDIA's hardware-accelerated equivalent that runs on the Jetson VIC (Vision Image Compositor) hardware engine and operates on NVMM buffers. On a Jetson pipeline doing 4K or multi-stream work, replacing videoconvert with nvvidconv can cut CPU usage by 60-80% and reduce latency by half.
How do I enable GStreamer debug logs to diagnose pipeline issues?
Set GST_DEBUG=3 for general debug info: GST_DEBUG=3 gst-launch-1.0 .... For element-specific logs: GST_DEBUG=nvvidconv:5,nvinfer:4. To generate a pipeline graph: export GST_DEBUG_DUMP_DOT_DIR=/tmp, run the pipeline, then convert the .dot file with 'dot -Tpng /tmp/*.dot -o pipeline.png'. The graph shows all elements, caps, and buffer flows.
What is the maximum number of camera streams Jetson Orin can handle in GStreamer?
It depends on resolution, frame rate, and codec. Jetson AGX Orin can typically handle 8-16 1080p30 streams simultaneously using hardware decode (nvv4l2decoder) and nvstreammux for batching. Using software decode (avdec_h264) instead drops that to 2-4 streams before the CPU saturates. The VIC and NVENC/NVDEC engines are the real limit, not the CPU.
Why do I get 'no element named nvvidconv' on Jetson?
nvvidconv is part of the gstreamer1.0-plugins-nvargus package installed with JetPack. If it's missing, run sudo apt install --reinstall gstreamer1.0-plugins-nvargus. Also confirm your GStreamer plugin path includes the NVIDIA plugins: gst-inspect-1.0 nvvidconv should return the element description. If you're running inside a Docker container, the container needs --runtime=nvidia and the NVIDIA GStreamer libraries mounted in.
What is the difference between nvdrmvideosink and nv3dsink in GStreamer?
nvdrmvideosink renders directly to the DRM framebuffer, bypassing the compositor, best for full-screen, low-latency display on a headless Jetson or when running without a desktop session. nv3dsink renders through OpenGL into a window, which requires a running X or Wayland session. For production deployments and benchmarking, nvdrmvideosink is preferred. For development with a monitor, nv3dsink is more convenient.
How do I run a multi-stream GStreamer pipeline on Jetson with nvstreammux?
nvstreammux batches multiple input streams into a single batch buffer for nvinfer. Create one nvstreammux element, connect each camera source to a separate sink pad (sink_0, sink_1, etc.), set batch-size equal to the number of streams, and set width, height, and batched-push-timeout. nvinfer then processes the entire batch in one GPU inference call, which is far more efficient than one nvinfer per stream.
How much faster is nvv4l2decoder than avdec_h264 on Jetson Orin?
On Jetson Orin at 1080p30, nvv4l2decoder uses roughly 1-2% CPU and runs on the dedicated NVDEC hardware engine. avdec_h264 (software decode) uses 35-50% CPU for the same stream. At 4K30, software decode saturates the CPU entirely and drops frames; hardware decode stays under 3% CPU. The gap widens with resolution and stream count.
Why does my Jetson GStreamer pipeline drop frames at high resolution?
Frame drops at high resolution usually mean one of three things: a CPU-based element is the bottleneck (check for videoconvert or avdec_h264), the MIPI CSI bandwidth is saturated (more common on multi-camera setups), or the appsink callback is too slow and the queue is full. Run the fakesink benchmark pipeline from this post to isolate the bottleneck, if fakesink drops frames, the issue is upstream of your processing.
How do I stream a Jetson GStreamer pipeline over RTSP?
Use gst-rtsp-server or the udpsrc/udpsink pattern. The simplest approach: nvarguscamerasrc ! nvvidconv ! nvv4l2h264enc ! h264parse ! rtph264pay ! udpsink host=<receiver_ip> port=5000. On the receiver: gst-launch-1.0 udpsrc port=5000 ! 'application/x-rtp,encoding-name=H264,payload=96' ! rtph264depay ! avdec_h264 ! autovideosink. For a proper RTSP server with multiple clients, use the gst-rtsp-server library or rtspsrc/rtsp-server element from gst-plugins-bad.
What end-to-end latency should I target for a Jetson GStreamer pipeline?
For live camera-to-display: under 100ms is achievable with hardware elements, under 50ms with careful tuning (sync=false on sinks, leaky queues, nvv4l2decoder). For camera-to-network (UDP): 50-150ms is typical depending on encoder GOP settings. For camera-to-inference: 30-80ms for single-stream on Orin AGX with nvinfer. Any pipeline using software decode (avdec_h264) or videoconvert will add 20-80ms of unnecessary latency.
How many GStreamer processes can run on Jetson before performance degrades?
One. On Jetson, running multiple GStreamer pipelines in separate processes causes nvvidconv performance collapse, each process initializes a separate instance of the VIC hardware context, and they compete for the same hardware resource. The result is that 2 separate processes each running at 30fps may drop to 10-15fps each. Always run multi-stream pipelines in a single process using nvstreammux, or use DeepStream which manages the hardware context correctly across streams.

Written by
Andrés CamposCo-Founder & CTO · ProventusNova
8 years deep in embedded systems, from underwater ROVs to edge AI. Andrés leads every technical delivery personally.
Connect on LinkedInRelated Articles
How to Reduce End-to-End Latency in a GStreamer Pipeline on Jetson
Practical techniques for reducing GStreamer pipeline latency on NVIDIA Jetson: sync flags, queue tuning, NVMM memory, and hardware decode paths.
nvvidconv performance collapse with multiple GStreamer processes on Jetson
Running multiple GStreamer pipelines as separate processes on Jetson? nvvidconv throughput can drop 5-10x. Here's why VIC contention causes it and the.
How to create a hardware-accelerated GStreamer pipeline for live streaming on Jetson
Build a low-latency GStreamer live streaming pipeline on NVIDIA Jetson using nvv4l2h264enc and udpsink or gst-rtsp-server. RTSP, UDP, and SRT examples.
GStreamer pipeline examples for Jetson: nvarguscamerasrc, nvvidconv, encode, and decode
GStreamer pipeline examples for Jetson: nvarguscamerasrc, v4l2src, hardware H.264/H.265 encode, nvv4l2decoder, nvvidconv, kmssink, and debugging commands.